The joy of graphical debugging
I’m a very visual type of guy. A picture really does say more than a thousand words. It should come as no surprise that my way of coding and debugging reflects this.
How does one debug a fluid solver? It is possible to step through the code, but that does not provide much insight. Most of the operations are quite trivial: you don’t need a debugger to see what’s going to happen on that low level. You can inspect the state of the solver, but that state consists of a handful of big matrices: not very insightful.
What you really want is to see what’s going on. My fluid solver gradually evolved from a simple display of the output into a program that allowed me to inspect the complete state, both graphically and numerically.
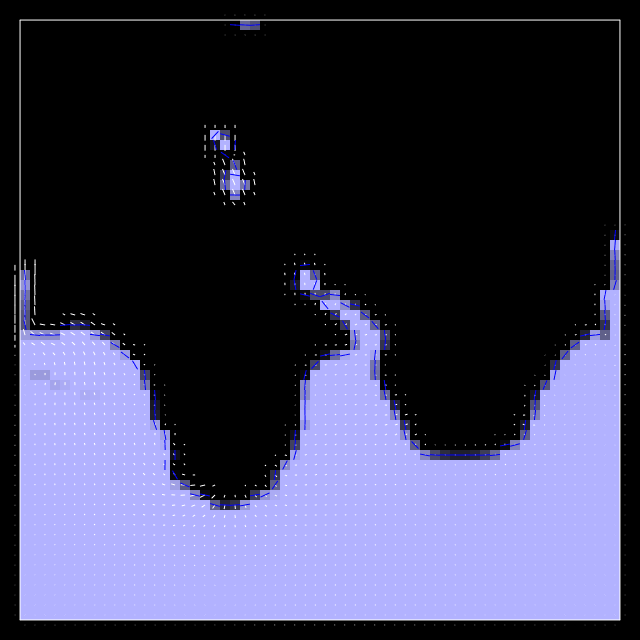
The screenshots you have seen so far already give a hint of what’s in there. This is actually a graphical representation of the VOF (Volume Of Fluid) matrix, which contains values between 0 and 1. A 0 means an empty cell, which is rendered in black; a 1 means a full cell, which is rendered in light blue. The white lines indicate the current velocity of the fluid at that point. The blue lines indicate the computed orientation of the surface; they are only rendered on surface cells.

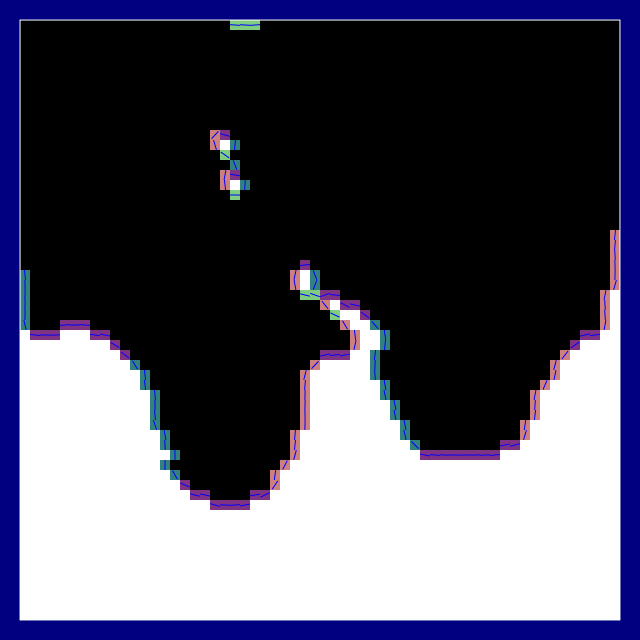
A surface cell is defined as any cell which neighbours an empty cell. Remaining cells which are not empty or walls are labeled as fluid cells. The type of a cell is very important for its treatment in the simulation, hence, there is also a mode that displays cell types in different colours:

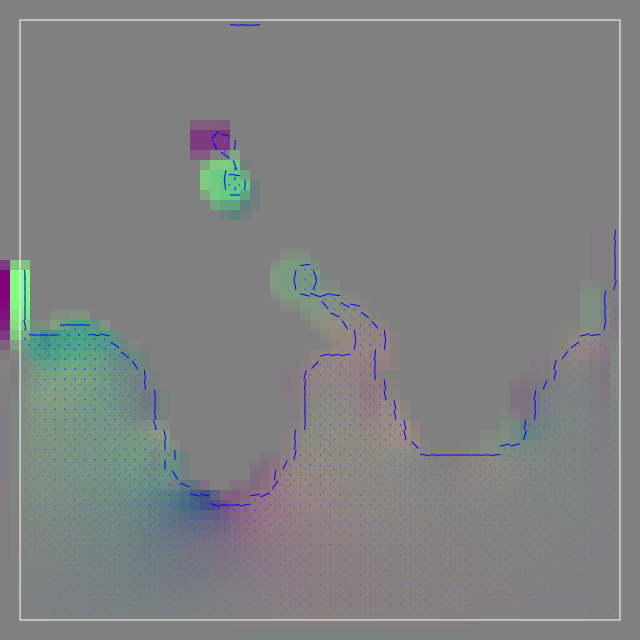
An alternative view of the fluid velocity uses colours to convey the horizontal and vertical velocity components, as shown below. The amount of red corresponds to the horizontal component; the amount of green to the vertical. It takes some practice to interpret this data, so perhaps the arrows are more convenient, but they become very cluttered at high resolutions. The screenshot below also shows little blue arrows inside the fluid. These represent the flux: the amount of fluid moving from one cell to another across the cell boundary.

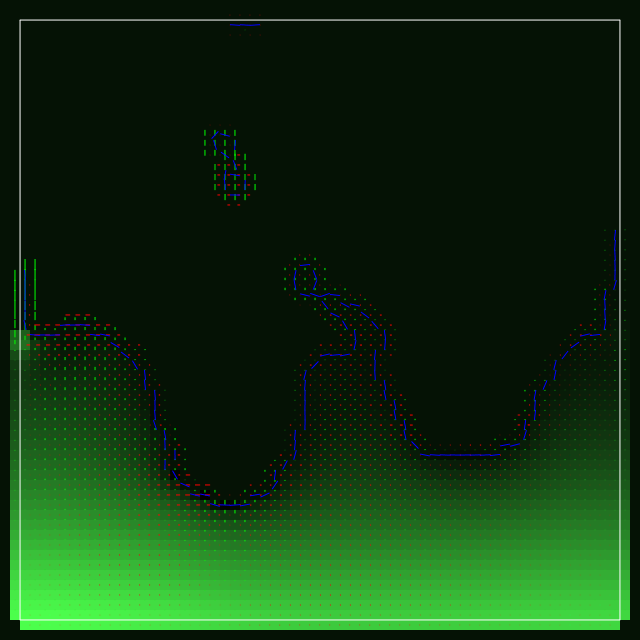
Finally, one very useful view mode is the pressure. The larger the pressure, the more green appears. The red and green “arrows” here are similar to the white arrows before: they represent the velocity, but show the horizontal and vertical components separately. This is useful because these are not defined at the same location: horizontal velocities are defined on vertical cell boundaries and vice versa.

However nice graphical debugging is, sometimes you want to be able to get the exact numbers. Maybe you want to do some back-of-the-envelope calculations to determine whether the values you see make sense. For this, I added what I call “probing”. If you click the fluid anywhere, all information about the cell you clicked is printed to the console:
Probing cell (33, 32) of type SurfaceTop:
- VOF = 0.301235
- p = -0.000165525
- pseudodiv = 0
- div = 0
- peta = 1.24807
- normal = (0.567809, 1.21864)
- velocities:
          0.14629
  0.13468          0.13468
          0.14629
- pressure coefficients:
          0.229561
       0 (     1)      0
               0
- fluxes:
          0.00014629
       0          4.21951e-05
               0
Every time I find myself groping in the dark, unsure of what’s going on inside my program, I hack up some visualization to show it to me. Not only is it fun, but it’s also incredibly helpful.